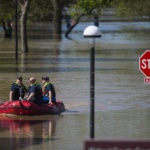
Flooding is the costliest — and the most common — natural disaster to significantly impact communities across the United States, The PEW Charitable Trust notes in its reporting on flood-prepared communities. Flood events have accounted for more than $850 billion in damage and losses in the U.S. since 2000, the global nonprofit, nongovernmental organization points out.
It doesn't take a hurricane to create a flood event. After all, just one inch of water in a structure can cause up to $25,000 of damage, according to FEMA. But the run-up to the Atlantic hurricane season is nevertheless a good time to consider flood insurance. This year it is especially important for risk professionals to talk to their clients about flood insurance, in part because of FEMA's roll out this year of a new rating system for the National Flood Insurance Program (NFIP), Risk Rating 2.0, and because of the growing market for private flood insurance.
FEMA's new rating methodology will increase flood insurance rates for 3.8 million homeowners, according to an analysis by ValuePenguin.com. Not every NFIP policyholder will see a rate increase, however. Some may experience no change in rates while the cost for flood insurance will decrease for some 1.2 million homeowners, ValuePenguin reported.
FEMA's Risk Rating 2.0 goes into effect on Oct. 1, 2021, for new policies and April 1, 2022, for renewals.
Meanwhile, the interest by private insurers in offering flood coverage is expanding. A report published by the Insurance Information Institute in April 2021 shows that in 2020, the number of private carriers writing flood insurance grew to 175, up from 152 in 2019 and 127 in 2018.
Whether it's public or private flood coverage, however, "every property in the United States needs to see a flood insurance quote. So that the property owner has an opportunity to understand the [risk] for flood at that location, as well as what it would cost to protect that property," says Jim Watje, who heads up the private flood division of St. Petersburg, Florida-based Wright Flood Insurance.
"Our recommendation to all of our agents, regardless of whether they represent us or someone else, or just offer the NFIP program, is that our obligation as an industry is to let property owners know that flood insurance is available and is warranted really everywhere across the country," Watje told Insurance Journal.
Wright Flood, which Watje says is one of the largest — and longest participating — providers in the NFIP’s write your own (WYO) program, created and designed its private flood division “to provide additional options for property owners across the country.”
As little as seven years ago, flood was generally thought to be uninsurable in the private space, Watje said. But technology has changed all that. With the technology available "today from an engineering perspective … and from a geospatial data acquisition perspective … private companies now are very, very confident that they have the ability to evaluate the risk of flooding at a specific location that would provide them [the ability] to offer products they believe would not only generate a decent return … but also be able to pay claims that would result from that event," he said.
Watje said it's hard to tell at this point just how big the market for private flood insurance is, but a new line of reporting now being required of insurance companies by the National Association of Insurance Commissioners (NAIC) in their annual statements may soon begin to offer some insight. "We'll see more industry data that will be able to define what the private flood market is and how it's grown year to year. I see numbers thrown out that vary from 60% growth year over year but usually it's starting at a very low base. And it's tough to put your finger on exactly what that number is," he said.
A 2019 report on the private flood insurance market by Wells Media's Research & Trends division found private flood insurers reported total direct premiums written of $681 million in 2018, an increase of $51 million over 2017. The majority of the growth was in commercial flood insurance.
The Wells Media report shows that 30% of the U.S. private flood market is written in seven Gulf and Atlantic coast states identified by CoreLogic as having the highest potential for storm surge damage — Florida, Louisiana, Texas, Virginia, South Carolina, North Carolina and Georgia.
Nationally, the NFIP has some five million flood insurance policies in force, Butch Kinerney, branch chief, National Flood Insurance Marketing and Outreach, for the NFIP, said during a virtual panel discussion on flood insurance in June 2020. "We are in every state, every territory, every tribal nation. We are in more than 23,000 participating communities nationwide. We cover $1.3 trillion in assets, all against flood. About 95% of our policies are residential and about 5% of our policies are nonresidential."
Current NFIP limits for residential coverages are $250,000 for the structure and $100,000 for the contents. For commercial structures, limits are $500,000 for the building and $500,000 for the content.
Private flood insurance limits for both buildings and contents usually run higher than that. For instance, Wright Flood offers dwelling limits up to $1 million and personal property limits of $250,000, Watje said.
Coverage in the private flood market can go as high as $5 million for a residential property, including content replacement costs, according to Caitlin Connor, flood strategy coordinator with Johnson & Johnson Insurance in Tampa/St. Petersburg, Florida, who joined the NFIP's Kinerney in the June 2020 panel discussion on flood insurance.
However, as Watje says, whether public or private, only about "15% of properties in the United States actually carry flood insurance. And when we think about 85% of properties across the country do not carry that protection, really you can be aggressive as you want in what you think the market would be in terms of potential for premium dollars."
Meanwhile, research released by the First Street Foundation in February 2021 showed that nearly 4.3 million residential properties in the U.S. are vulnerable to substantial flood risk that would be economically damaging.
The average estimated annual loss for each of those properties is $4,694 per property, with an estimated cumulative total of $20 billion in annualized damage this year. That total annual loss is expected to grow by 61% over the next 30 years due to the impact of climate change to an estimated total loss of $32.3 billion, according to First Street Foundation.
Those individual and total annual numbers increase somewhat when properties with any risk of flooding at all are included.
Risk Rating 2.0
Currently, the NFIP evaluates structures according to the flood zones in which they appear on a Flood Insurance Rate Map (FIRM), occupancy type, and their elevation compared to a Base Flood Elevation (BFE). Under the current nationwide rating system, the topographical features for an individual structure are not necessarily reflected in the flood risk upon which the individual policy is rated. Two properties, even if they are in different states but are located within a certain flood zone may be charged the same rate even though they have different flooding experiences and they are situated differently from a topographic standpoint.
Many properties under the current NFIP rating system are eligible for less than full risk rates. They include: properties built or substantially improved before the first FIRM was published in 1974; most properties newly mapped into a Special Flood Hazard Area on or after April 15, 2015, if flood coverage was purchased within a year of the mapping; and "grandfathered" properties that had coverage in compliance with a prior FIRM but were remapped into a different rate class or BFE.
"As proposed, NFIP premiums calculated under Risk Rating 2.0 will reflect an individual property's flood risk, in contrast to the current rating system in which properties with the same NFIP flood risk are charged the same rates. This will involve the use of a larger range of variables than in the current rating system, both in terms of modeling the flood risk and also in assessing the risk to each property," FEMA states in a summary of the new rating system.
Even with the new rating system, certain properties will continue to be eligible for reduced rates, at least at first.
For instance, for properties "newly identified to be at high risk, for the first 12 months after the maps become effective, the [preferred risk] rates stay in effect if coverage is purchased during those 12 months. … Then the rates start to stair step up slowly over time," said Bruce Bender, with Resilience Action Partners, during a recent FEMA-sponsored webinar on the impacts of the new map changes and rating system.
Another way to lock-in rates for both pre- and post-FIRM properties is through grandfathering, Bender said. In both cases, continuous coverage is required for the old rates to stay effective once the new map changes go into effect. In other words, these properties must have a policy in place before the maps change. Eligible properties that are newly mapped into a higher BFE can grandfather the lower BFE for future rating, as well.
With the 2021 map changes, some properties may be classed into a lower risk category, in which case those properties may be converted to a lower rate as long as there is no gap in coverage. The insured will get a refund on the difference, if applicable.
FEMA's intention for Risk Rating 2.0 is to start bringing insurance premiums for the NFIP up to the point where they better reflect the risk associated with each insured property. While many properties will see their rates increase over time, the increase is limited to 18% annually for any individual rate until the full rate is reached. The average increase is capped at 15% annually. Commercial structures in high-risk areas may see rate increases of 25%. In addition, certain secondary or vacation homes, will see rate increases of 25% until the full risk rate is achieved.
| Where Will the Largest Proportion of Homeowners Pay More for Flood Insurance? | ||||
| State | Total # of flood insurance policies in effect | Percentage of homeowners who will pay more for flood insurance | Percentage of homeowners who will pay less for flood insurance | Percentage of homeowners whose flood insurance premiums will increase more than $240 a year |
| Hawaii | 61,400 | 87% | 13% | 4% |
| Texas | 768,600 | 86% | 14% | 3% |
| Mississippi | 61,300 | 84% | 16% | 4% |
| West Virginia | 13,300 | 83% | 17% | 8% |
| Florida | 1,727,900 | 80% | 20% | 4% |
| Louisiana | 495,900 | 80% | 20% | 3% |
| New Jersey | 217,200 | 79% | 21% | 5% |
| Alabama | 52,700 | 79% | 21% | 3% |
| Nevada | 10,600 | 79% | 21% | 3% |
| Georgia | 82,000 | 76% | 24% | 2% |
| Arizona | 29,300 | 75% | 25% | 2% |
| South Carolina | 208,600 | 74% | 26% | 3% |
| North Carolina | 139,800 | 74% | 26% | 3% |
| California | 215,000 | 73% | 27% | 4% |
| Idaho | 5,600 | 73% | 28% | 3% |
| Tennessee | 27,500 | 72% | 28% | 5% |
| Kentucky | 19,400 | 71% | 28% | 6% |
| Oklahoma | 13,000 | 71% | 30% | 4% |
| Minnesota | 10,500 | 71% | 29% | 3% |
| Pennsylvania | 51,600 | 70% | 30% | 7% |
| Oregon | 24,900 | 70% | 30% | 4% |
| Missouri | 19,700 | 70% | 30% | 7% |
| South Dakota | 3,700 | 70% | 31% | 4% |
| New York | 171,100 | 68% | 32% | 7% |
| Vermont | 3,300 | 68% | 33% | 8% |
| Washington | 32,500 | 67% | 33% | 4% |
| Arkansas | 14,400 | 67% | 33% | 4% |
| Maine | 7,700 | 67% | 34% | 9% |
| Wyoming | 1,700 | 67% | 33% | 3% |
| New Hampshire | 7,700 | 66% | 35% | 7% |
| New Mexico | 11,600 | 64% | 35% | 2% |
| Connecticut | 35,000 | 63% | 36% | 9% |
| Iowa | 12,600 | 63% | 37% | 6% |
| Montana | 4,300 | 63% | 38% | 2% |
| Delaware | 26,100 | 62% | 38% | 2% |
| North Dakota | 13,200 | 62% | 38% | 1% |
| Kansas | 9,600 | 62% | 38% | 3% |
| Massachusetts | 58,500 | 61% | 39% | 6% |
| Illinois | 38,000 | 58% | 41% | 4% |
| Colorado | 20,000 | 57% | 43% | 4% |
| Nebraska | 9,100 | 57% | 44% | 7% |
| Wisconsin | 12,900 | 56% | 44% | 2% |
| Virginia | 104,800 | 55% | 45% | 2% |
| Ohio | 29,000 | 55% | 45% | 4% |
| Indiana | 20,100 | 54% | 46% | 3% |
| Rhode Island | 12,000 | 54% | 46% | 3% |
| Michigan | 20,500 | 46% | 54% | 1% |
| Utah | 3,800 | 46% | 53% | 1% |
| Maryland | 65,000 | 39% | 61% | 1% |
| District of Columbia | 2,400 | 27% | 72% | 1% |
| Alaska | 2,300 | 14% | 84% | 1% |
Source: ValuePenguin

Comments
Add Comment